
Nutrient Separation Process
Polymer-assisted mechanical separation for cleaner lagoon water and concentrated phosphorus management.
The Nutrient Separation Process reduces suspended solids, phosphorus, and volatile solids from digestate or pressate while producing a P-reduced effluent and a concentrated cake.
Phosphorus reduction
75-85%
TSS reduction
>90%
Hauling volume
15%
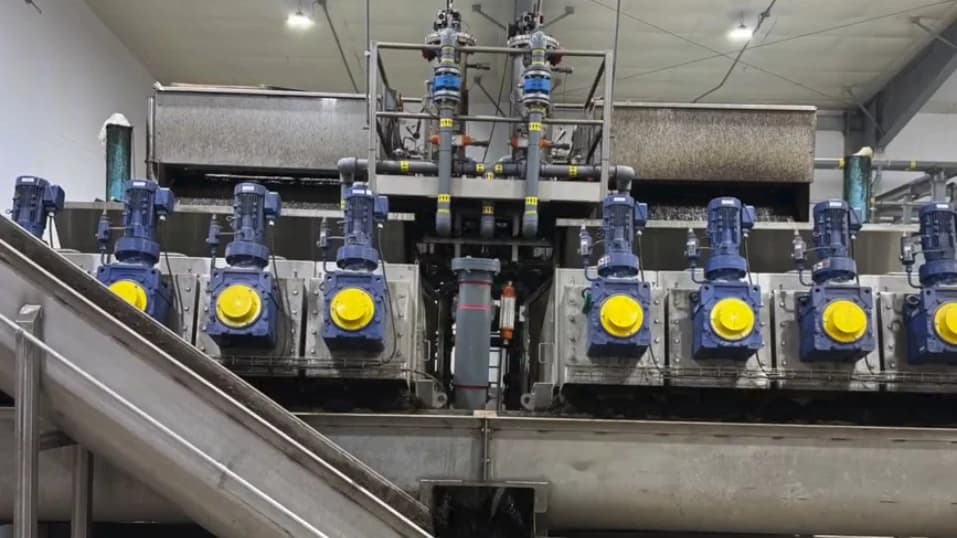
Reduced Effluent
Cleaner effluent for lagoon storage or downstream manure management.
Concentrated Cake
Higher-solids material at roughly one-tenth of the original volume.
Managing digestate and pressate is operationally difficult.
The deck frames NSP around phosphorus limits, suspended solids, hauling volume, and lagoon-related operating pressure.
Phosphorus-saturated land limits local application.
High suspended solids reduce flushing efficiency and drive lagoon maintenance costs.
Long-distance hauling and liquid manure disposal increase operating costs.
Higher volatile solids increase lagoon gas emissions.
Typical baseline composition from the supplied presentation.
Total solids
3.70%
Phosphorus
400 ppm
930 ppm as P2O5Total suspended solids
21,900 ppm
Total volatile solids
2.1%
Total Kjeldahl nitrogen
0.26%
Potassium
0.25%
Sulfur
0.02%
Calcium
0.16%
Magnesium
0.07%
Sodium
0.22%
Iron
87 ppm
Zinc
40 ppm
Polymer-assisted mechanical separation
NSP uses DAF-style separation with polymer addition to reduce suspended solids and phosphorus while concentrating material into a manageable cake.
NSP / DAF Relationship
The Nutrient Separation Process (NSP) uses DAF-style, polymer-assisted mechanical separation to remove suspended solids and concentrate phosphorus-rich material into a manageable cake.
Primary Outputs
The process produces a P-reduced effluent for lagoon storage or downstream manure management, plus a concentrated cake stream.
Volume Reduction
Cake volume is approximately one-tenth of the original stream, reducing hauling and disposal volume.
Performance at a Glance
| Metric | Before | After NSP | Total Impact |
|---|---|---|---|
| Total solids | 3.70% | 1.7% | Significant lagoon solids reduction |
| Phosphorus | 400 ppm | 70 ppm | 75-85% P reduction |
| Total suspended solids | 21,900 ppm | 2,100 ppm | >90% TSS reduction |
| Total volatile solids (TVS) | 2.1% | 0.8% | >60% TVS reduction |
| Pressate volume for long-distance disposal | 100% | 15% | 80-90% volume reduction |
Typical composition before and after NSP
These tables reproduce the baseline pressate composition and the NSP output composition reported in the supplied presentation.
Baseline / Pressate Typical Composition
| Metric | Unit | Typical value |
|---|---|---|
| Total solids | % | 3.70% |
| Phosphorus | ppm | 400 ppm |
| Phosphorus (P2O5) | ppm | 930 ppm |
| Total suspended solids | ppm | 21,900 ppm |
| Total volatile solids (TVS) | % | 2.1% |
| Total Kjeldahl nitrogen (TKN) | % | 0.26% |
| Potassium | % | 0.25% |
| Sulfur | % | 0.02% |
| Calcium | % | 0.16% |
| Magnesium | % | 0.07% |
| Sodium | % | 0.22% |
| Iron | ppm | 87 ppm |
| Zinc | ppm | 40 ppm |
NSP Typical Composition
| Metric | MD Press Cake | Effluent | Effluent Reduction |
|---|---|---|---|
| Total solids | 20.4% | 1.7% | 53% |
| Phosphorus | 3,300 ppm | 70 ppm | 84% |
| Total suspended solids | 0 | 2,100 ppm | 90% |
| Total volatile solids (TVS) | 13.6% | 0.8% | 62% |
| Total Kjeldahl nitrogen (TKN) | 0.90% | 0.20% | 23% |
| Potassium | 0.28% | 0.23% | 7% |
| Sulfur | 0.11% | 0.01% | 44% |
| Calcium | 0.96% | 0.03% | 84% |
| Magnesium | 0.32% | 0.03% | 54% |
| Sodium | 0.19% | 0.19% | 12% |
| Iron | 609 ppm | 10 ppm | 88% |
| Manganese | 68 ppm | 2 ppm | 85% |
| Zinc | 248 ppm | 5 ppm | 89% |
Values represent typical composition and expected performance based on the supplied presentation data.
See it in Action
A visual walkthrough of the separation process from incoming pressate to concentrated cake and cleaner effluent.
Budgetary requirements from the deck
The presentation provides preliminary facility, capital, polymer, and utility assumptions for a reference installation.
Footprint
1,000-2,000 sq ft building space
Installed CAPEX
$1.5M based on 5,000 head / 173,000 GPD
Polymer OPEX
$100K-$200K per year
Utilities
Very low electrical usage
Five-step implementation sequence
The supplied presentation outlines a straightforward progression from sizing through operator training.
System sizing and specifications
Equipment procurement
Equipment installation
Commissioning
Operator training
Internal reference summary
Content on this page is aligned to the supplied Nutrient Separation Process presentation and intended for internal technical-commercial use.